Business Intelligence Masters Program

Categories
BI & Visualization
Read Review
5.0 (3750 satisfied learners)

Business Intelligence Masters Program trained in tools and systems utilized by Business Intelligence Professionals.

Course Description for Business Intelligence Masters Program

This Business Intelligence certification study contains detailed training on Data Warehousing and BI, Power BI, Informatica, and Tableau. Our Business Intelligence Masters Program will help you mine that data and enhance the decision-making processes throughout your organization.

Business Intelligence Course Masters Program is a structured knowledge path guided by leading industry professionals. It guarantees that you change into a complete Business Intelligence professional by becoming an expert in Data Warehousing, Data Modeling, Teradata, MongoDB, Informatica, Talend, and BI tools like MSBI and IBM.

Business analytics is a very reliable means of business insight based on the data and statistics of the business performance of the past. It is an excellent asset to your business. Business analytics will give you an idea of the decision-making process about the model to use to better your business.

There are no prerequisites for enrollment in the Business Intelligence Course Masters Program.

experienced professional working in the IT industry, an aspirant planning to enter the world of Business Intelligence

They utilize data to project business and market trends to enable organizations to increase their productivity and profits. They gather the data in multiple ways, such as utilizing software to mine computer data and looking at data from industry trends and competitors.

BI analysts can identify trends that can help other departments, managers, and executives make business decisions to modernize and improve processes in the organization through data analytics, data visualization, and data modeling techniques and technologies.

The need for suitable business intelligence analysts and managers is expected to soar to 14% by 2026, with the general need for data professionals to rise to 28% by the same year.

BI is a broad term containing data mining, process analysis, performance benchmarking, and descriptive analytics. BI parses all the data induced by a business and presents easy-to-digest reports, performance standards, and trends that tell management findings.

What you'll learn in Business Intelligence Masters Program

  • Topics covered but not limited to will be : Data Warehousing, Data Mining, ETL, Data Modelling, Advanced Database Concepts, Data Migration, Data Transformations, Performance Tuning, Data Visualization & Reporting, OLAP using SSAS, SSIS, SSRS, MSBI, MicroStrategy, Tableau,Cognos BI, QlikView, Power BI, Talend, NoSQL DB concepts, MongoDB Architecture, Pentaho BI, Teradata, Informatica PowerCenter etc.

Requirements of Business Intelligence Masters Program

  • There are no prerequisites for enrollment to the Business Intelligence Course Masters Program. Whether you are an experienced professional working in the IT industry, or an aspirant planning to enter the world of Business Intelligence, Masters Program is designed and developed to accommodate various professional backgrounds.

Curriculam of Business Intelligence Masters Program

Learn Data Warehousing and Business Intelligence with various ETL Tools and BI Tools with ERwin r9 Data Modeling.

What is Data Warehousing?
Definitions by W.H. Inmon [Top-Down Design],
Ralph Kimball [Bottom-Up Design],
Inmon Vs. Ralph Kimball,
Data Warehousing Tools,
Schema Modeling Tools,
CA,
Erwin,
Dell Toad Data Modeler,
Oracle Data Modeler,
ETL Tools: Informatica Power Center,
Talend DI Open Studio,
IBM Data Stage,
SAS,
Data Warehousing categories,
What is BI - Business Intelligence?
BI Definition,
BI Tools,
Classification of BI Tools.

learn about the Data Warehouse Architecture, which talks about the Various Source Systems, i.e., Production Data into Relational, Flat File, and various legacy systems to Staging areas and finally into the Data Warehousing/Data Mart for the presentation layer.

Relational Vs. Analytical.
What are - OLTP, OLAP, OLAP categories - MOLAP, ROLAP, HOLAP,
Data Warehouse Vs. Data Mart,
Dependent and Independent Data Mart,
Data Warehouse Architecture,
Source System,
ETL Extraction,
Transformation.
What is a cube?
Benefits of the cube?
How to create the cube?
How to deploy a cube?
How to create a report using a cube?

know about other categories of Dimensional and Fact Type tables.

What is a Dimension Table?
Dimension table categories,
FACT TABLE - What is a Fact Table?
Fact Table Granularity,
Fact Table categories.

learn about Data Normalization and its three types of forms, the type of dimensional modeling, benefits, principles, and characteristics.

What is Data Normalization?
Data Normalization Rules - 1NF, 2NF, 3NF,
Data De-Normalization,
Dimensional Modeling - What is DM?
Principles,
Benefits,
Type and Technique.

learning to create a staging and target data warehouse and data marts from scratch to final. Develop the SQL scripts via ERwin r9.

Source System Understanding,
Future Data Requirement and Understanding,
Designing and Developing Dimension Table,
Creating and Developing Fact Table Creating and Developing ER Model With Erwin,
Designing and Developing Entity-Relationship Modeling.

Know about the open-source and commercial ETL Tools available in the market and their various comparisons. Make the flat file and relational target through Talend DI Open Studio 5. x using various Transformations.

Open source ETL Talend DI Open Studio
The distinction between Licensed and Open Source ETL Tools,
What are Licensed and Open Source ETL Tools?
Operating with ETL Transformation in Talend Open DI Studio.

learn to create the actual business model and data integration jobs with the management of various ETL items. You will learn how the actual ETL Projects work with BRD[Business Requirement Document] and TDD [Technical Design Document] and their uses.

Building ETL Project Talend DI Open Studio,
Comprehending the Data Source System, which is a future Data Requirement,
Identify Business Requirement Gathering,
Building the ETL Talend Technical Design Document,
Building an ETL Project.

learn about the Data Visualization Tools available in the market.

Data Visualization BI Tool: Tableau 9. x-
Introduction to Data Visualization with Tableau,
Exploring Data Visualization with Tableau.
What is Data Visualization?
Exporting Data and Working With Tableau.

discover to create reports and dashboards via Tableau 9. x utilizing advanced features and functions. Understand the various current and new report requirements.

Building Data Visualization BI Project With Tableau 9. x,
BI Reporting Understanding,
Report and Dashboard Template Document,
Tableau Design and Development Database Source Connection.

Learn integrated Data Warehousing and Business Intelligence Project, which starts from User Source System and Business Requirement Gathering till the end of Project Development with production support strategies developments.

An Integrated Data Warehousing & BI Project,
Developing a Data Warehouse and BI Project,
Source System learning today's data that will be the future data requirement,
Identify the Business Requirement Gathering,
Report and Dashboard Template Document,
Designing and Developing Models,
Designing and Developing the Staging Area,
Finalizing the Dimension Modeling Type,
Designing and Developing Dimension Modeling.

know the building blocks and the different fundamental concepts of Power BI.

Business Intelligence,
Self Service Business Intelligence,
SSBI Tools, Power BI vs. Tableau vs. QlikView,
What is Power BI,
Why Power BI?
Critical Benefits of Power BI,
The flow of Power BI,
Components of Power BI,
The architecture of Power BI,
Building Blocks of Power BI,
Question Bank

Understand Power BI Desktop, how to extract data from various sources and base connections with Power BI Desktop, perform modification operations on data, and the Role of Query Editor in Power BI.

Overview of Power BI Desktop,
Data Sources in Power BI Desktop,
Connecting to a data Sources,
Query Editor in Power BI,
Query Ribbon,
Clean and Transform Data with Query Editor,
Combining Data – Merging and Appending,
Cleaning irregularly formatted data,
Views in Power BI Desktop,
Modelling Data,
Manage Data Relationship,
Automatic Relationship Updates,
Template Apps,
Cross Filter Direction,
Create calculated tables and measures,
Optimizing Data Models,
BIDS Files, Question Bank

discover the basics of DAX in Power BI Desktop.

Essential concepts in DAX,
Why is DAX important?
DAX Syntax,
Data Types in DAX,
Ranking and rank over groups,
Filter and evaluation context,
Context interactions,
Calculation Types,
DAX Functions ,
Measures in DAX,
DAX Operators,
DAX tables and filtering,
DAX queries,
Create simple and compound measures,
Schema relations,
Star schema design,
DAX Parameter Naming,
Question Bank

comprehend the advantages and best practices of Data Visualization. It will also assist you in making charts utilizing Custom Visuals.

Introduction to visuals in Power BI
Charts in Power BI
Matrixes and tables
Slicers
Map Visualizations
Gauges and Single Number Cards
Create scatter, waterfall, and funnel charts
Modifying colors in charts and visuals
Shapes, text boxes, and images
What Are Custom Visuals?
Page layout and formatting
KPI Visuals
Z-Order
Explore time-based data
AppSource
Question Bank

Learn to create Dashboards and publish them on Power BI services.

Introduction to Power BI Service,
Introduction to using workspaces,
Dashboard vs. Reports,
Quick Insights in Power BI,
Creating Dashboards,
Configuring a Dashboard,
Power BI Q&A,
Ask questions about data with natural language,
Power BI embedded,
Create custom Q&A suggestions,
Edit tile details and add widgets,
Build apps,
Integrate OneDrive for Business with Power BI,
Question Bank, Case Study

know how to connect data sources directly to Azure, HD Spark, and My SQL, and build interactive dashboards.

Intro to utilizing Excel data in Power BI
Exploring live links to data with Power BI
Linking directly to SQL Azure, HD Spark, SQL Server Analysis Services/ My SQL
Introduction to Power BI Development API
Import Power View and Power Pivot to Power BI Data caching and refresh
Introducing Power BI Mobile
Question Bank

comprehend Power BI Report Servers and data gateways. Learn about the web portal where you display and manage reports and KPIs.

Report Server Basics,
Web Portal,
Paginated Reports,
Row-level Security,
Data Gateways,
Scheduled Refresh,
Configure scheduled refresh,
Create a publish-to-web embed code,
Customize the sample Power BI file

Learn to create R and Python visuals in Power BI Desktop and Power BI Service

R Integration in Power BI Desktop,
R visuals in Power BI,
R Powered Custom Visuals,
Creating R visuals in Power BI,
R Visuals in Power BI Service,
R Scripts Security,
Creating visuals using Python

Perform advanced analysis using Anomaly Detection and Smart Narrative visualization in Power BI.

Using Parameters
Create a data flow
Introduction to Anomaly Detection
Introduction to Smart Narrative
Introduction to Sensitivity labels in Power BI
Deployment Pipeline

Learn to develop a specific project where you will incorporate all your learnings of Power BI.

The project covers all requirements of the course.

learn about different Informatica Products available and understand the overview of Informatica PowerCenter Product, Architecture, Terminology, Tools GUI, Mappings, Transformations, Sessions, Workflows, and Workflow Monitor.

Informatica & Informatica Product Suite
Informatica PowerCenter as ETL Tool
Informatica PowerCenter Architecture
Component-based development techniques
Installation of the Product in Windows and using Oracle as a Database
Design of the services and joining the client to the server

learn different Data Integration Concepts. Intro to the concepts - Data Profiling, Data Quality Management, ETL and ETL architecture, and Data Warehousing.

Data Integration Concepts
Data Profile and Data Quality Management
ETL and ETL architecture
Brief on Data Warehousing
Skim through the properties of the services required
Shutdown and start-up of the services from the Administration Console
Design and implementation of a simple pass-through mapping.

learn about different development units of PowerCenter and how they can be utilized to make a simple mapping and transformations.

Visualize PowerCenter client tools
Data Flow
Create & execute the mapping
Transformations & their usage
Use numerous transformations inside the mapping to resolve diverse service cases
Look at the effects of the transformations to customize them

learn about Advanced Transformation techniques, which will equip you to deal with advanced concepts of PowerCenter transformations like Java, XML, etc.

Advanced transformations (Java, SQL, Normalizer)
XML File Processing & Transaction Processing
Error handling features
Cleaning the data (Advanced Functions, Regular Expressions)
Reusability features
Usage of progressive transformations like XML Processing, Union, etc.
The usefulness of inbuilt and customized functions to fulfill the data transformation needs.
Reusable transformations, Sessions, Mapplets, etc.

learn advanced ETL scenarios using Informatica. You will be introduced to the concepts - Error Handling, Partitioning, PushDown Optimization, Incremental Aggregation, Constraint-Based Loading, Target Load Order Group, CDC (Change Data Capture), etc. We will also discuss creating data warehouse-related processes like SCD, Fact, and Dimension Loading.

Changed Data Capture, Incremental Aggregation, Constraint-Based Loading, etc.
Advanced techniques - Flat File, XML File
Loading Dimensional Tables (SCD-1, SCD-2, SCD-3)
Changed Data Capture, Incremental Aggregation, Constraint-Based Loading, etc.
Advanced techniques - Flat File, XML File
Loading Dimensional Tables (SCD-1, SCD-2, SCD-3)

understand the features provided by Informatica to debug, troubleshoot & handle errors to understand the inner workings and responsibilities of the operational role. Various PowerCenter recovery options for tasks and workflows will be discussed, along with the recommended best practices for the operations process.

PowerCenter Error,
Basic troubleshooting methodology,
Debugger,
Workflow and Session logs to diagnose errors,
Connection Errors & Network errors,
Recovery scenarios & mechanisms,
Configure workflow & sessions for recovery,
High Availability,
PowerCenter Environment,
Perform troubleshooting of Informatica errors,
Use of Debugger to debus a mapping,
Perform workflow and session recovery and related configuration needed for that

Learn the routine parts of Informatica PowerCenter components and their efficient usage. Discuss the best practices suggested by Informatica for optimum performance of your ETL process.

Performance Tuning Methodology,
Mapping design tips & tricks,
Caching & Memory Optimization,
Partition & Pushdown Optimization,
Design Principles & Best Practices,
Identify the bottlenecks,
Different configurations needed to resolve the bottlenecks,
Discover tips and tricks to efficient code mappings,
Cache and DTM buffer memory configuration

acquires details on the use and components of PowerCenter repository manager. Learn to migrate and manage the repository effectively.

Repository Manager tool (functionalities, create and delete, migrate components)
PowerCenter Repository Maintenance
Get acquainted with the repository manager tool and its functionalities
Creation and editing of a Folder
Copy Informatica objects
Historical view of session and workflow statistics

Discover the PowerCenter administration console, and identify and explain integration and repository service properties. Discuss the command-line utilities and utilize them to manage the domain and repository and start and control workflows.

Features of PowerCenter 10
Overview of the PowerCenter Administration Console
Integration and repository service properties
Services in the Administration Console (services, handle locks)
Users and groups
Learn details of different components of the Informatica Administration tool
Design user, the group, give privileges to the users and groups
Create Roles
Looking at the service logs, taking export of the service logs
Service maintenance from the Administration console

Learn the command line part of Informatica PowerCenter.

Infacmd, infasetup, pmcmd, pmrep
Automate tasks via command-line programs
Use Infacmd, infasetup, PMC MD, prep to automate tasks via command-line programs

Learn about Data Visualization and Tableau Prep Builder tool.

Data Visualization,
Business Intelligence tools,
Introduction to Tableau,
Tableau Architecture,
Tableau Server Architecture,
VizQL,
Introduction to Tableau Prep,
Tableau Prep Builder User Interface,
Data Preparation techniques utilizing the Tableau Prep Builder tool,
Create a simple data flow utilizing the Tableau Prep Builder tool,
Group and Replace feature utilizing Tableau Prep Builder tool,
Pivoting data using the Tableau Prep Builder tool,
Aggregate data using the Tableau Prep Builder tool,
Perform Unions and Joins using the Tableau Prep Builder tool

learn Tableau UI components and various ways to establish a data connection.

Features of Tableau Desktop
Connect to data from File and Database
Types of Connections
Joins and Unions
Data Blending
Tableau Desktop User Interface
Basic project: Make a workbook and publish it on Tableau Online
Joins using Tableau Desktop
Data Blending feature within Tableau
Make a Workbook and publish it over Tableau Online
Save a workbook in different formats

comprehend the significance of Visual Analytics and analyze the various charts, features, and techniques utilized for Visualization.

Visual Analytics,
Fundamental Charts: Bar Chart, Line Chart, and Pie Chart,
Hierarchies,
Data Granularity,
Highlighting,
Sorting,
Filtering,
Grouping,
Sets,
Basic Charts in Tableau,
Display Hierarchies, Data Granularity, and Highlighting features in Tableau,
Perform Sorting, Filtering, and Grouping techniques in Tableau,
Sets in Tableau

comprehend basic calculations such as Numeric, String Manipulation, Date Function, Logical and Aggregate. Intro to Table Calculations and Level Of Detail (LOD) expressions.

Types of Calculations
Built-in Functions (Number, String, Date, Logical, and Aggregate)
Operators and Syntax Conventions
Table Calculations
Level Of Detail (LOD) Calculations
Using R within Tableau for Calculations
Demonstrate calculations using Built-in Functions in Tableau
Function Fast Table and Level Of Detail (LOD) calculations in Tableau
Installing R and establishing a connection with R within Tableau

Learn Visual Analytics in a more powdery manner. It wraps various advanced techniques for analyzing data, including Forecasting, Trend Lines, Reference Lines, Clustering, and Parameterized concepts.

Parameters,
Tooltips,
Trend lines,
Reference lines,
Forecasting,
Clustering,
Demonstrate Parameters in Calculations,
Complete Data Visualization utilizing Trend lines, Forecasting, and Clustering feature in Tableau
Project 1- Domain: Media & Entertainment Industry

deep dive into progressive analytical scenarios, utilizing Level Of Detail expressions.

Case 1- Count Customers by Order
Case 2- Profit per Business Day
Case 3- Comparative Sales
Case 4- Profit Vs. Target
Case 5- Finding the second order date
Case 6- Cohort Analysis
All the use cases are Hands-on intensive

gain an understanding of Geographic Visualization in Tableau.

Introduction to Geographic Visualizations,
Manually assigning Geographical Locations,
Types of Maps,
Spatial Files,
Custom Geocoding,
Polygon Maps,
Web Map Services,
Background Images,
Make a Map and assign Geographic locations to the fields,
Explain how to make a Map from a Spatial file,
Know how to make a Filled Map, Symbol Map, and a Density Map,
Perform Custom Geocoding in Maps,
Build a Polygon Map,
Establish a connection with the WMS Server

know to plot different advanced charts in Tableau Desktop.

Box and Whisker's Plot,
Bullet Chart,
Bar in Bar Chart,
Gantt Chart,
Waterfall Chart,
Pareto Chart,
Control Chart,
Funnel Chart,
Bump Chart,
Step and Jump Lines,
Word Cloud,
Doughnut Chart,
All the above charts have Hands-on

understand to create Dashboards and Stories within Tableau.

Introduction to Dashboards,
The Dashboard Interface,
Dashboard Objects,
Building a Dashboard,
Dashboard Layouts and Formatting,
Interactive Dashboards with actions,
Designing Dashboards for devices,
Story Points,
Explain how to add objects to a Dashboard,
Create a simple Dashboard utilizing Layouts and Formatting features,
Create Interactive Dashboards using actions,
Learn to create a Dashboard for devices using Device Designer,
Build Stories with Dashboards,
In-class Project 2- Domain: Retail Industry

discover effective ways of creating Dashboards with minimum time investment.

Tableau Tips and Tricks,
Choosing the correct type of Chart,
Format Style,
Data Visualization best practices,
Prepare for Tableau Interview,
Hands-on experience on different tips and tricks with Tableau,
In-class Industry Grade Major Project-Domain: Transportation Industry

know to publish data, interact, modify, and secure the published data on Tableau Online.

Publishing Workbooks to Tableau Online
Interacting with Content on Tableau Online
Data Management through Tableau Catalog
AI-Powered features in Tableau Online (Ask Data and Explain Data)
Understand Scheduling
Managing Permissions on Tableau Online
Data Security with Filters in Tableau Online
Publishing Workbooks to Tableau Online
Interacting with Content on Tableau Online
Managing permissions on Tableau Online
Data security using User-based and Row-level filters

know to make Tableau reports for different industrial scenarios and broadcast them on Tableau Online. Discover to manage permissions and secure data using filters.

Project Statement: You are recruited as a freelancer for a Retail store that supplies Furniture, Office Supplies, and Technology products to customers across Europe. You are asked to create interactive dashboards that can gain insights into the profits for orders over the years.

FAQ for Business Intelligence Masters Program

The average salary for a business intelligence analyst is $85,705 per year

Business intelligence processes help you organize your data to be easily accessed and analyzed. Decision-makers can then quickly dig in and get the information, empowering them to make informed decisions.

Business Intelligence (BI) requires coding for processing data to produce valuable insights. Coding is used in the BI project lifecycle's data modeling and warehousing stages. Nevertheless, coding is not needed in the other stages of the BI lifecycle. Anyone can start a career in BI with some practice in programming.

To better understand the Business Intelligence Masters Program Certification Training, one must learn as per the curriculum.

Business intelligence is a technology-driven process, so people in BI need several hard skills, such as computer programming and database familiarity. However, they also need soft skills, including interpersonal skills.

Great BI helps businesses and organizations ask and answer questions about their data. Business intelligence can help companies make better decisions by showing present and historical data within their business context.

Relevant and verifiable experience in the BI analyst field. Excellent leadership and interpersonal skills. A firm grasp of business strategy and KPIs. A fundamental understanding of SQL and the technical aspects of BI.

By enrolling in the Business Intelligence Masters Program Training and completing the module, you can get the CertZip Business Intelligence Masters Program Certification.


product-2.jpg
$3295 $3469
$174 Off
ADD TO CART

Training Course Features

Assessments
Assessments

Every certification training session is followed by a quiz to assess your course learning.

Mock Tests
Mock Tests

The Mock Tests Are Arranged To Help You Prepare For The Certification Examination.

Lifetime Access
Lifetime Access

A lifetime access to LMS is provided where presentations, quizzes, installation guides & class recordings are available.

24x7 Expert Support
24x7 Expert Support

A 24x7 online support team is available to resolve all your technical queries, through a ticket-based tracking system.

Forum
Forum

For our learners, we have a community forum that further facilitates learning through peer interaction and knowledge sharing.

Certification
Certification

Successfully complete your final course project and CertZip will provide you with a completion certification.

Business Intelligence Masters Program

A Business Intelligence Masters Program Training is a certification that demonstrates that the holder has the proficiency and aptitudes needed to work with Business Intelligence.

The suggested time to complete this program is 25 weeks. However, it is up to the individual to complete this Business Intelligence Online Certification at their own pace.

Yes, We will be providing you with a Business Intelligence Certificate of completion for every course that is a part of the learning pathway once you have successfully submitted the final assessment and our subject matter experts have verified it. Upon completing the course, you will receive a BI Business Analyst Certificate online.
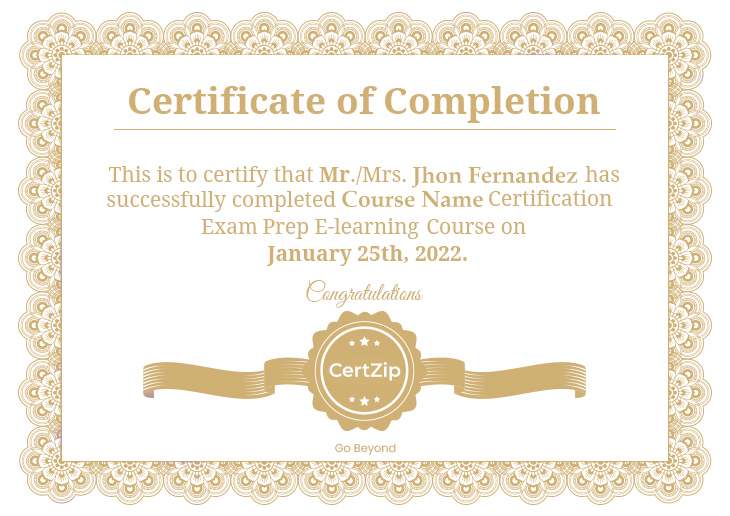
demo certificate

Reviews

Q Quinn Edwards
J John
C Camila Rodriguez
J Jacob
J Jacob
S Samuel
C Christoper
A Amanda
P Peter
J Jarrel

Related Courses

Discover your perfect program in our courses.

Bestseller

Bestseller

Bestseller

Contact Us

Drop us a Query

Drop us a Query

Available 24x7 for your queries